VBAL and XBAL both target 60% stocks and 40% bonds, which makes them look interchangeable. My previous article compared their equity holdings. This one looks inside the bond allocation: what the bonds are supposed to do, why they have offered less protection since 2020, and how the different mixes respond to changes in interest rates, credit markets and the Canadian dollar.
Section 1
The Asset-allocation ETF Universe
Choices, choices, choices
Eight major providers offer broad-market asset-allocation ETF families in Canada. Together, the funds listed below held roughly $90 billion as of July 29, 2026. Vanguard, iShares and Fidelity offer choices from 100% equities through portfolios with 80% fixed income. BMO, TD, Mackenzie, CIBC and Global X stop at the 40/60 tier. TD's growth fund targets 85/15, while CIBC's targets 75/25.
Universe of Asset Allocation ETFs
PROVIDER | Growth | Balanced | Conservative | Income |
|---|---|---|---|---|
Vanguard | VGRO | VBAL | VCNS | VCIP |
RBC iShares | XGRO | XBAL | XCNS | XINC |
Fidelity | FGRO | FBAL | FCNS | FCIP |
BMO | ZGRO | ZBAL | ZCON | N/A |
TD | TGRO (85/15) | TBAL | TCON | N/A |
Mackenzie | MGRW | MBAL | MCON | N/A |
CIBC | CGRW (75/25) | CBLN | CCON | N/A |
Global X | HGRW | HBAL | HCON | N/A |
The detailed bond analysis covers seven providers with comparable disclosed holdings: Vanguard, iShares, BMO, TD, CIBC, Mackenzie and Global X. Fidelity is excluded because its bond allocation is actively managed and deserves a separate analysis.
section 2
What is Actually Inside the Bond Allocations?
On two headline measures, the seven families look remarkably similar. Estimated duration ranges from 6.3 to 7.0 years, while yield to maturity ranges from 3.5% to 3.8%. Their building blocks are much less alike.
Duration estimates the initial price effect of a change in yields. A duration of 6.8 years means that a parallel one-percentage-point rise in yields would reduce the bond allocation's value by about 6.8%, all else equal. Yield to maturity is not a return forecast; it is a snapshot of the yield embedded in the current holdings before fees, defaults and future portfolio changes. It applies only to the bonds. An asset-allocation ETF's distribution also depends on its bond weight and the dividends paid by its stocks.
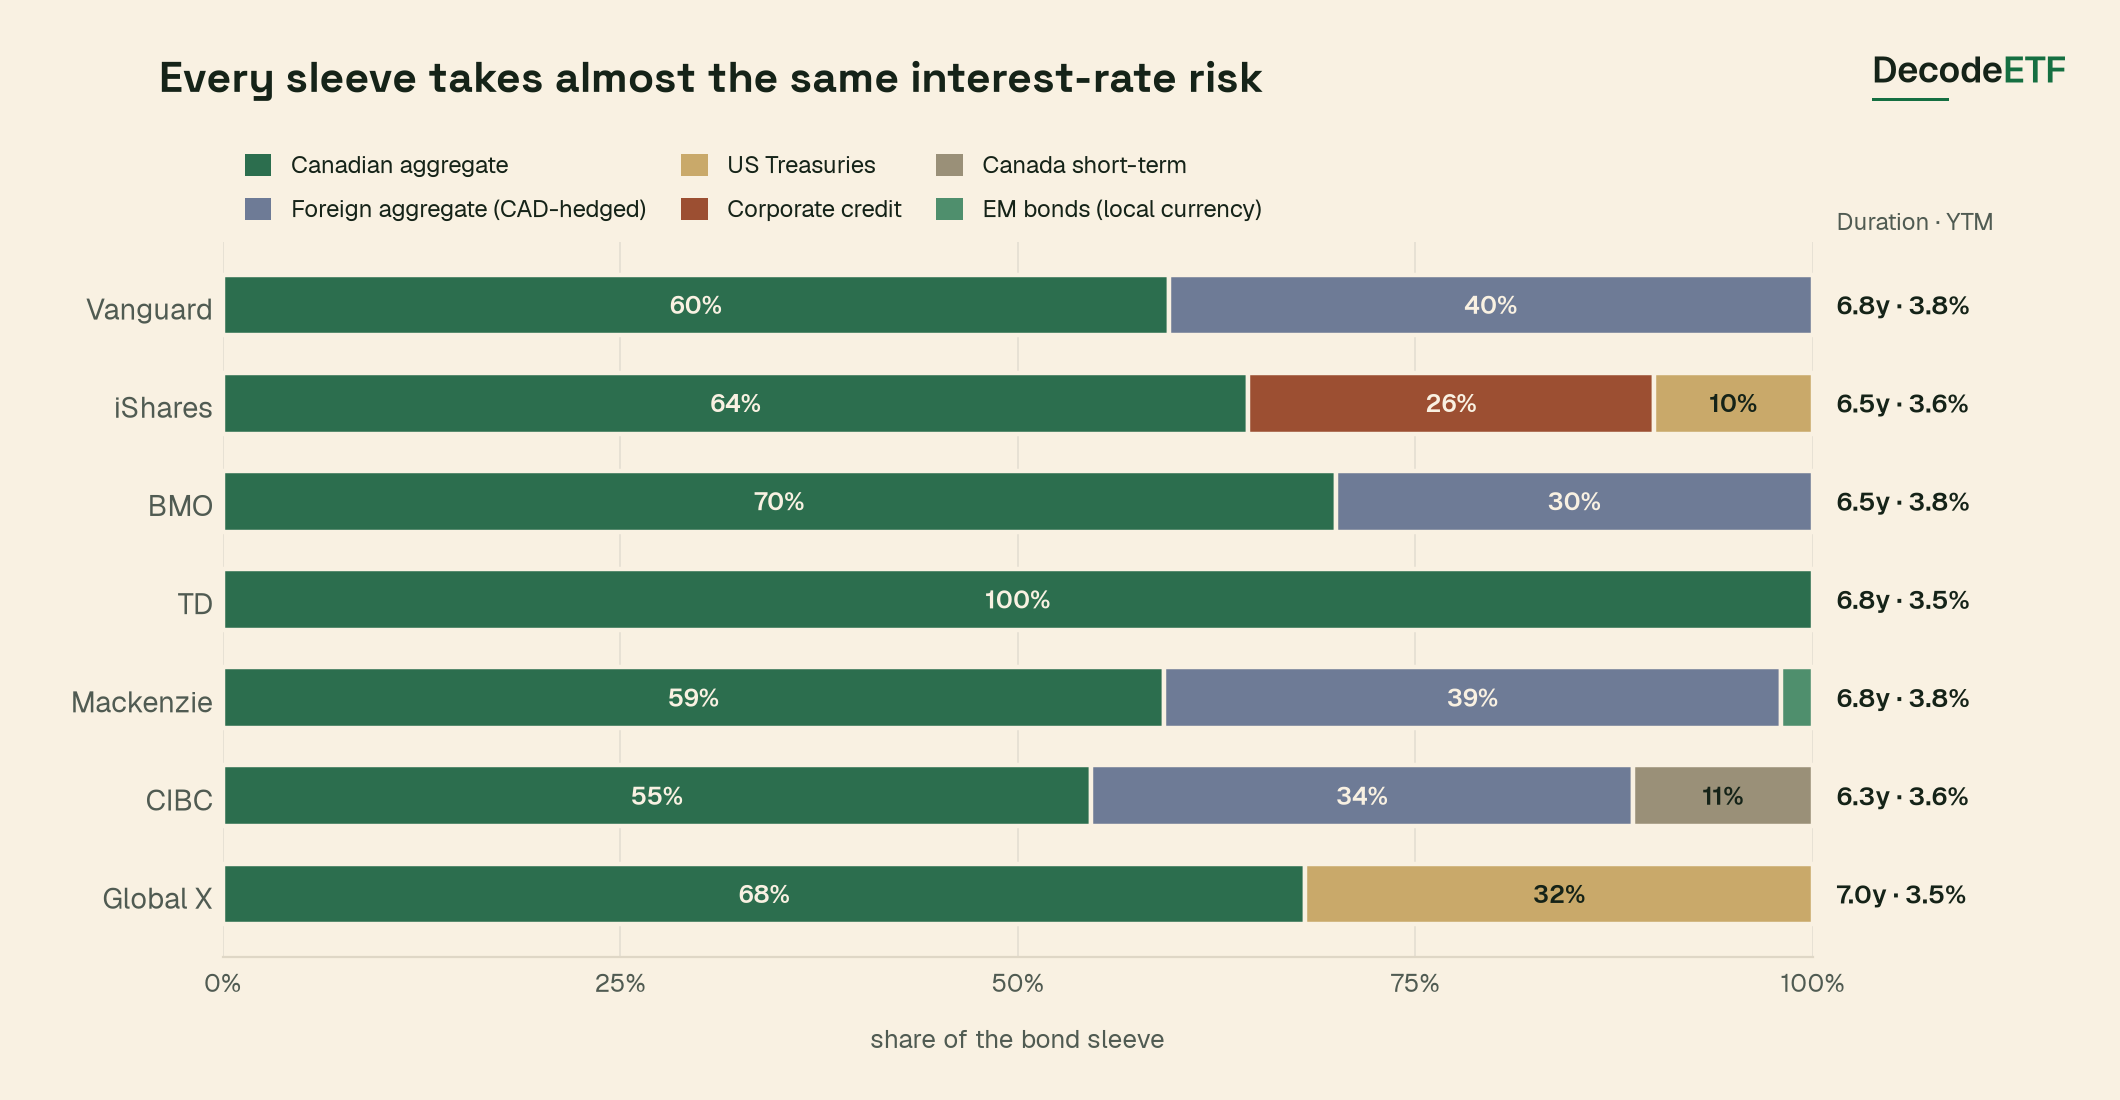
Figure 1
Bond building blocks used by each provider, based on disclosed holdings from May through July 2026. The mix is effectively the same across a provider's growth, balanced and conservative tiers. Duration and yield to maturity are weighted estimates from issuer disclosures; dates vary by provider.
Here is where the allocations differ.
TD uses a single bond ETF, the TD Canadian Aggregate Bond Index ETF (TDB). TDB holds investment-grade bonds issued in Canadian dollars. That does not mean every issuer is Canadian: its holdings include Canadian-dollar bonds from Amazon and Alphabet.
Vanguard uses three bond ETFs: the Vanguard Canadian Aggregate Bond Index ETF (VAB), the Vanguard Global ex-U.S. Aggregate Bond Index ETF (CAD-hedged) (VBG) and the Vanguard U.S. Aggregate Bond Index ETF (CAD-hedged) (VBU). About 40% of the bond allocation is invested outside Canada, with the currency exposure hedged to Canadian dollars.
Mackenzie uses four bond ETFs: the Mackenzie Canadian Aggregate Bond Index ETF (QBB), the Mackenzie U.S. Aggregate Bond Index ETF (QUB), the Mackenzie Developed ex-North America Aggregate Bond Index ETF (CAD-Hedged) (QDXB) and the Mackenzie Emerging Markets Local Currency Bond Index ETF (QEBL). About 40% of the bond allocation is invested outside Canada. QUB and QDXB are hedged to Canadian dollars; QEBL is not.
CIBC uses three bond ETFs: the CIBC Canadian Short-Term Bond Index ETF (CSBI), the CIBC Canadian Bond Index ETF (CCBI) and the CIBC Global Bond ex-Canada Index ETF (CAD-Hedged) (CGBI). Depending on the portfolio, CGBI represents about 34% to 37% of the bond allocation.
RBC iShares uses the iShares Core Canadian Universe Bond Index ETF (XBB), the iShares Core Canadian Short Term Corporate Bond Index ETF (XSH), the U.S.-listed iShares Broad USD Investment Grade Corporate Bond ETF (USIG) and the U.S.-listed iShares U.S. Treasury Bond ETF (GOVT). XSH and USIG give iShares the largest dedicated corporate-bond allocation in the group; XBB adds more corporate exposure. About 20% of the bond allocation is outside Canada, with that currency exposure hedged to Canadian dollars.
Global X uses the Global X Canadian Select Universe Bond Index Corporate Class ETF (HBB), the Global X U.S. 7-10 Year Treasury Bond Index Corporate Class ETF (HTB) and the Global X 1-3 Year U.S. Treasury Bond Index ETF (TSTX.U). The target is about 30% of each portfolio's bond allocation in U.S. Treasuries. TSTX.U is not currency-hedged on its own. HCON and HBAL currently hedge their U.S. bond exposure at the portfolio level; HGRW does not.
BMO splits its bond allocation between Canadian and U.S. bonds. Roughly 70% is held through ZDB, a Canadian investment-grade discount-bond ETF, and about 30% through ZUAG.F, a currency-hedged U.S. aggregate-bond ETF. ZDB holds low-coupon bonds trading below face value. They still pay interest, but more of their expected return comes from price appreciation toward face value and less from coupon income. That structure can reduce taxable interest distributions and improve after-tax results in a non-registered account.
Now you may ask how do these differences impact your returns. Before I can answer that question I’m afraid I have to ask you three additional chapters to lay the groundwork to my answer.
section 3
What Jobs do Bonds do?
Inside an asset-allocation ETF, bonds have three jobs.
Job 1: Reduce volatility
Bonds move less than stocks. Shifting part of a portfolio from equities to bonds therefore reduces overall volatility even when the two assets move in the same direction.
Since VEQT launched in 2019, its annualized volatility has been about 16%. Moving down Vanguard's allocation ladder, the figure falls to roughly 13% for VGRO, 10% for VBAL, 8% for VCNS and 6% for VCIP. During the March 2020 selloff, VEQT fell about 30% from peak to trough, compared with about 21% for VBAL.
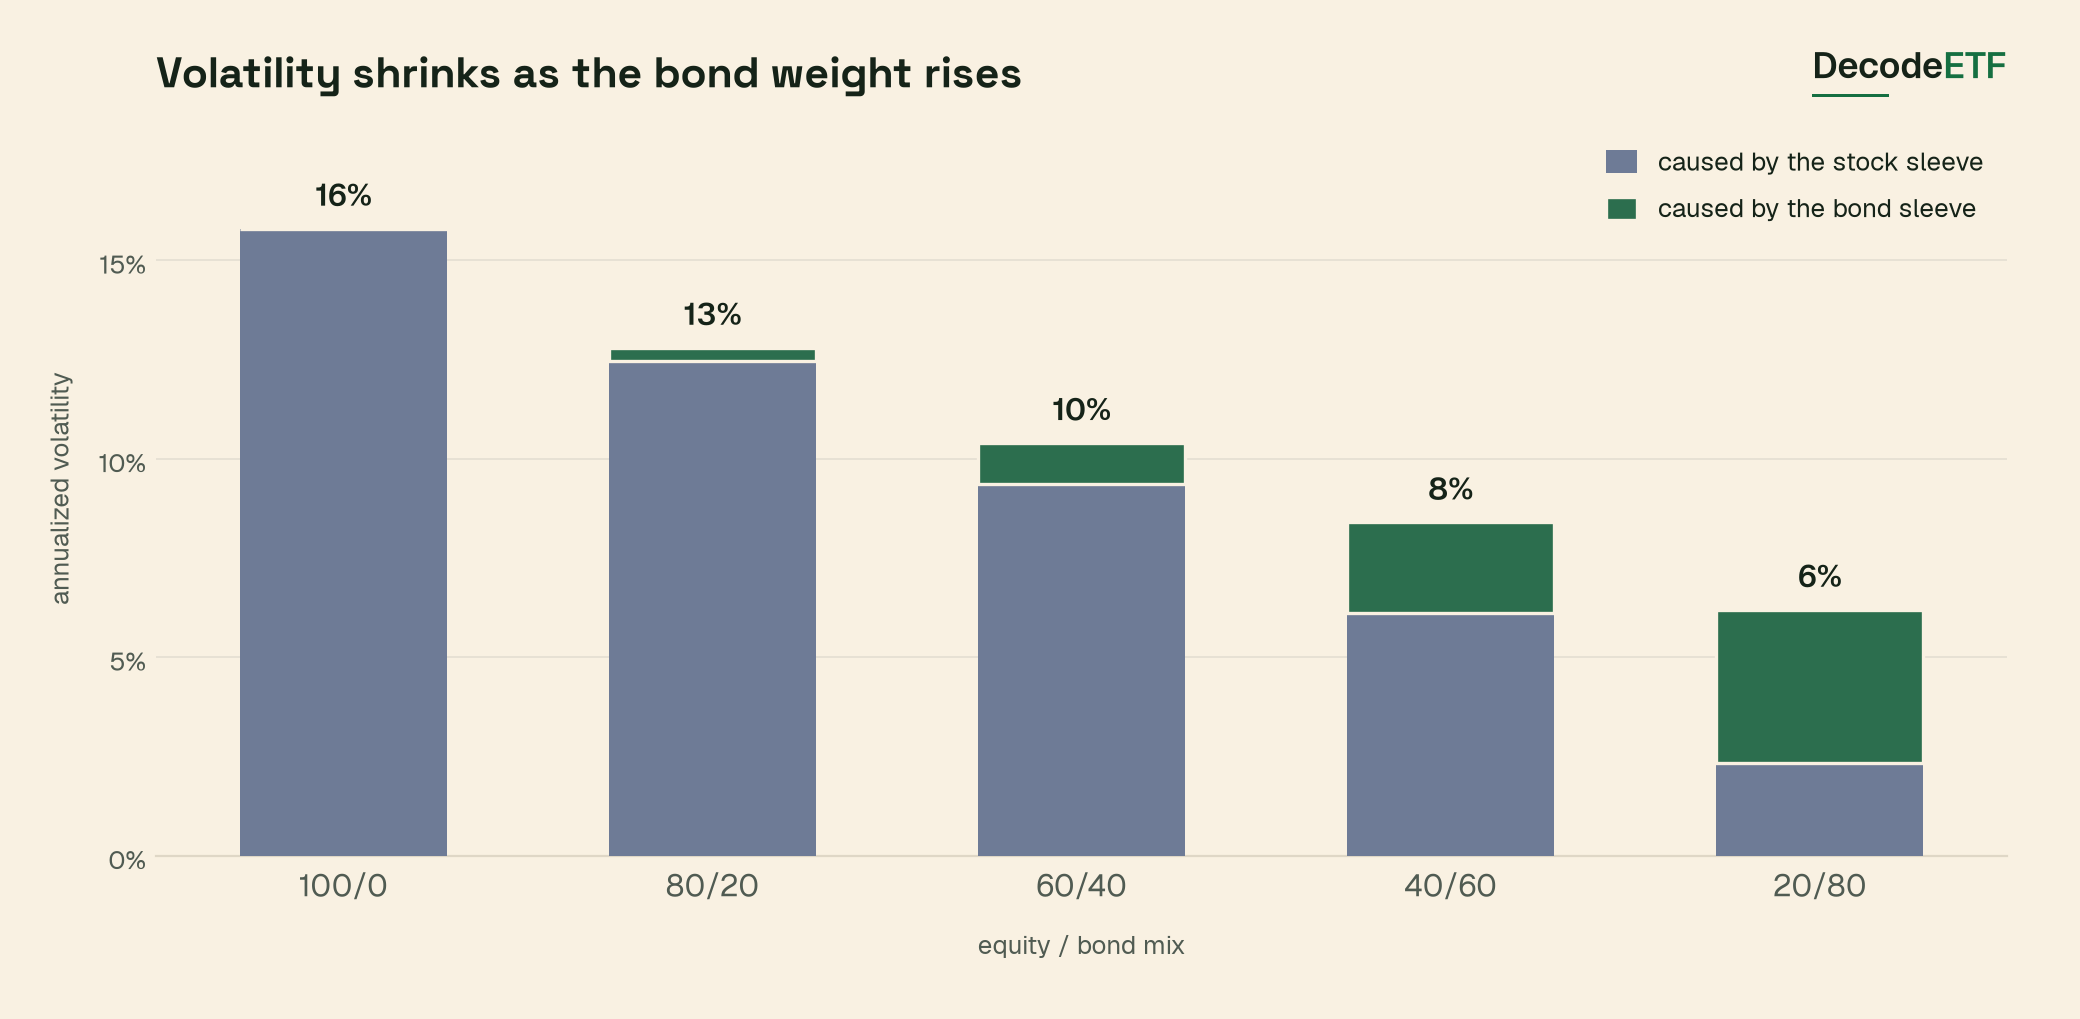
Figure 2
Annualized volatility of Vanguard's five asset-allocation ETFs, using daily total returns from February 2019 through July 2026.
Shallower declines matter to retirees who are withdrawing money. Selling during a deep drawdown locks in losses. Lower volatility also helps investors avoid abandoning a plan during a stressful market.
Lower volatility has a cost when stocks outperform bonds, and that cost was substantial in this period. From 2019 through July 2026, $10,000 invested in VEQT grew to about $26,000, compared with about $18,000 in VBAL.
For a longer comparison, a simulated VEQT-style portfolio used 30% Canadian equity and 70% global equity excluding Canada, measured in Canadian dollars. A 60/40 version placed 40% in XBB and rebalanced monthly. Over roughly 25 years, the all-equity mix compounded at 8.4% annually and the 60/40 mix at 6.7%, turning $10,000 into approximately $77,000 and $52,000, respectively.
Job 2: Generate Income
Income was less compelling when the first Canadian asset-allocation ETFs launched. VBAL and VGRO arrived in 2018, near the end of a long decline in bond yields. By 2020, yields on many high-quality government bonds were near zero.
The 2022 repricing changed the starting point. As of July 2026, XBB's trailing 12-month distribution yield was about 3.4%, compared with about 4.2% for the corporate-bond ETF XCB. Asset-allocation ETF distribution rates also rose, although those distributions include equity dividends and are not a pure measure of bond income.
Higher starting yields give new bond investors more income and a larger cushion against price declines.
Job 3: Diversify equity risk
For much of the period from the early 2000s through the late 2010s, high-quality bonds often rose when stocks fell. Many major shocks were demand or growth shocks. Investors expected central banks to cut rates, and falling rates lifted bond prices.
A simulated VEQT-style equity portfolio fell 29% during the dot-com bust while Canadian aggregate bonds gained 17%. During the 2007-09 financial crisis, the equity sleeve fell 41% while bonds gained 11%. During the 2011 European sovereign-debt crisis, equities declined 14% while bonds gained 7%.
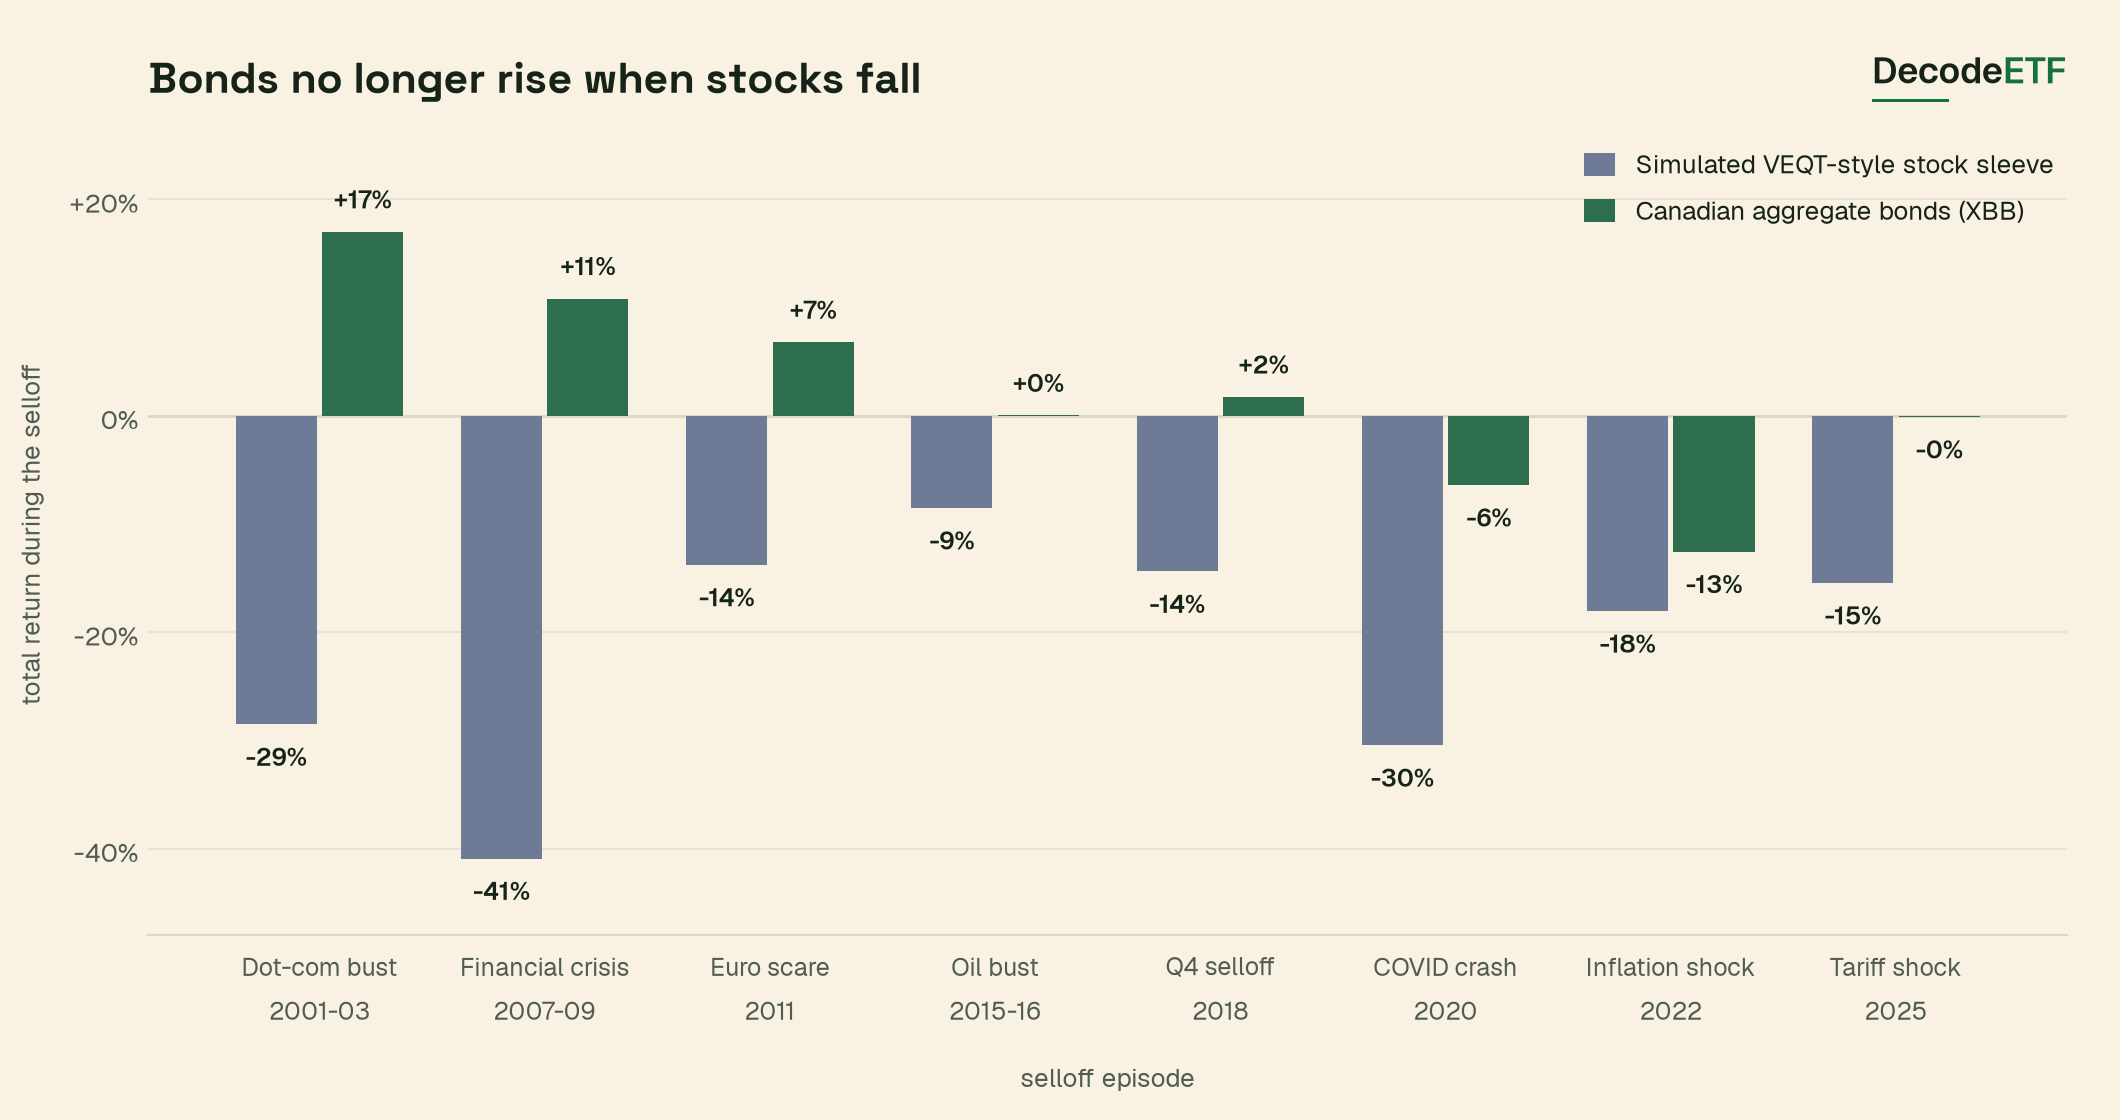
Figure 3
Total return of a simulated VEQT-style equity sleeve - 30% Canadian equity and 70% global equity excluding Canada, in Canadian dollars - compared with XBB over selected stock-sleeve peak-to-trough windows.
That relationship broke down after 2020. During the 2022 inflation shock, Canadian aggregate bonds lost about 13% while the simulated equity sleeve lost about 18%. Other recent selloffs have also produced little or no offset from broad bonds.
section 4
Why Did the Hedge Fail?
The key distinction is the source of the shock. Growth shocks tend to reduce demand and inflation. Central banks respond by cutting interest rates, which supports bond prices. Supply shocks slow growth while pushing inflation higher. That forces central banks to hold rates high or raise them even as stock prices fall.
Several major shocks since 2020 have had a supply component. Russia's invasion of Ukraine drove energy prices sharply higher. The 2026 war in the Middle East and the closure of the Strait of Hormuz delivered another energy shock. Tariffs can also act like a negative supply shock when they raise input costs and force companies to reorganize supply chains.
A recent IMF analysis reached the same conclusion: post-pandemic inflationary supply shocks made bonds less effective at cushioning sharp equity selloffs. The stock-bond relationship changes with the economic regime.
section 5
Will Diversification Return?
Yes - in a growth shock. When inflation is anchored and economic weakness gives central banks room to cut rates, government bonds again provide meaningful protection during an equity selloff. However, investors must distinguish that diversification question from a second issue: the amount and maturity of debt that markets must absorb.
Heavy government borrowing
At the 2025 Hague summit, NATO members committed to invest 5% of GDP annually in defence and broader security-related priorities by 2035: at least 3.5% for core defence and up to 1.5% for areas such as infrastructure, resilience and the defence industrial base. Most of that spending will be financed through government borrowing.
The OECD estimates that gross sovereign borrowing across member countries reached a record US$17 trillion in 2025 and projects about US$18 trillion in 2026. Net new borrowing is expected to approach US$4 trillion, the second-highest amount on record. Although markets have absorbed the additional debt, investors are demanding higher yields to hold long-term government bonds, prompting governments to issue more short-term debt. ETF investors now face a trade-off. Long-term bonds now offer more income, but they can also suffer larger price declines and may provide less protection when rising inflation or government borrowing pushes yields higher.
The AI infrastructure buildout
The AI infrastructure boom is increasing corporate borrowing as well. S&P Global Ratings estimates that Alphabet, Amazon, Meta, Microsoft and Oracle will spend approximately US$750 billion on capital projects in 2026. BIS researchers report that corporate bonds have become these companies’ principal source of external financing. Their bond issuance exceeded US$100 billion in 2025, with most of the debt maturing more than five years from issuance.
Shifting global reserve demand
China’s management of its foreign reserves also appears to be changing. Brad Setser of the Council on Foreign Relations notes that China’s US bond holdings became harder to identify after the G7 froze Russia’s reserves in 2022. His reconstruction indicates that China now holds a smaller share of its portfolio in long-term Treasuries, more Treasury bills and a substantial portfolio of US agency bonds. Some holdings may be recorded under non-US financial centres rather than China.
This is not evidence that China has abandoned the US dollar. Setser estimates that US assets still represent approximately 50% to 55% of China’s reserves, but long-term Treasuries appear to have lost share in the portfolio.
Combined with record government borrowing and weaker demand from some other long-term investors, this shift can put upward pressure on long-term yields independent of economic conditions.
section 6
What do These Differences Mean to Me?
Now, I can answer the question I posted earlier: why should we care about the bond allocation choices in these asset-allocation ETFs? Each bond allocation is better positioned for a different kind of shock.
In a growth-driven downturn, Global X would likely provide more protection than iShares. Falling interest rates and demand for safe assets would support Global X’s government bonds, while the heavier corporate-bond exposure in iShares could weaken alongside stocks as concerns about defaults increase.
An inflation or interest-rate shock produces no obvious winner. The bond allocations have broadly similar estimated duration, so none has a decisive advantage in its sensitivity to rising rates. The source and geographic reach of the inflation shock would determine the result.
During corporate credit stress without a rally in government bonds, Global X and TD would be better positioned than RBC iShares. Their bond allocations have less direct exposure to the widening corporate credit spreads that cause corporate bonds to lose value.
Vanguard and CIBC provide more protection against a Canada-specific fiscal or credit event because they invest in foreign as well as Canadian bonds. Currency hedging removes most exchange-rate exposure, but it preserves diversification across governments, companies and interest-rate markets. TD would be the most exposed because its bonds are denominated entirely in Canadian dollars and respond primarily to conditions in the Canadian bond market.
If Canadian interest rates fall relative to rates elsewhere, TD would benefit most directly from rising Canadian bond prices. HGRW could also benefit as its US Treasury exposure is not hedged to Canadian dollars, so a stronger US dollar would add to its Canadian-dollar return. Vanguard and CIBC hedge their foreign bonds, meaning their returns would depend primarily on movements in foreign bond prices rather than foreign currencies.
The result is that the best bond allocation depends on the risk being considered. Global X is positioned more defensively against corporate credit stress, RBC iShares accepts more corporate risk in exchange for additional yield, Vanguard and CIBC provide greater geographic diversification, and TD offers the most direct exposure to Canadian interest rates. HGRW adds an unhedged US-dollar component that can either help or hurt depending on the direction of the Canadian dollar.
section 7
What should an Investor Take from This?
These ETFs remain a low-cost, convenient way to hold a diversified stock-and-bond portfolio and keep it near a chosen allocation. The point is that the bond percentage is only a starting point.
How large a decline could you tolerate without selling?
A larger bond allocation reduces portfolio volatility even when bonds do not rise during an equity selloff. Investors who cannot withstand large losses need a more conservative mix.
When will you need the money?
The bond sleeves examined here have durations of six to seven years. A one-percentage-point rise in yields therefore cuts their value by roughly 6% to 7%. Higher interest income then works to recover that loss over time.
An investor who bought XBB at its August 2020 total-return peak and reinvested distributions was still approximately 7% below that peak four years later and approximately 2% below it in July 2026. This demonstrates that recovery from a major bond decline can take years.
Time horizon must still be considered in the context of the entire financial plan. Beginning retirement withdrawals in five years is not the same as spending the entire portfolio in five years. Only a portion is withdrawn at the beginning of retirement, while most of the money remains invested for much longer.
Which bad scenario concerns you most?
The bond allocations have similar overall interest-rate sensitivity, but their issuer, geographic and credit exposures differ. Government-heavy portfolios are more resilient during corporate credit stress. Foreign bonds diversify exposure beyond Canadian issuers and interest rates. A larger allocation to corporate bonds generates more income but provides less protection when concerns about corporate defaults increase.
Investors who specifically need short-term or low-volatility fixed income will not obtain it from these ETFs. They would need to combine separate stock and short-term bond ETFs instead.
The practical decision is therefore straightforward:
Choose the overall stock-and-bond allocation based on your capacity to withstand losses and when you will need the money, then
Use the composition of the bond allocation to choose among otherwise similar funds.
section 8
Conclusion
Bonds still perform two important jobs inside Canadian asset-allocation ETFs. They reduce overall portfolio volatility and provide substantially more income than they did during the low-yield years when most of these products launched. Their role as a diversifier however failed during the inflationary supply shocks that followed the pandemic.
That experience makes the composition of the bond allocation more important. Two funds can advertise the same 60/40 mix while holding very different combinations of Canadian and foreign bonds, government and corporate debt, and hedged and unhedged currency exposure. The headline allocation tells you how much you have invested in bonds. It does not tell you which risks those bonds carry or how they will respond to the next market shock.
Choose the stock-and-bond mix based on the losses you can withstand and when you will need the money. Then look inside the bond allocation. The percentage is only the starting point.
ETF insights, straight to your inbox
We break down what Canadian ETF investors need to know. Free. No account needed. Unsubscribe anytime.