Introduction
Just buy XEQT? Or VEQT, TEQT, ZEQT, HEQT, FEQT, CEQY, CAGE? No, this is not another generic head-to-head comparison of the all-equity ETFs written to drive search engine traffic. The purpose of this article is to explain how these portfolios are built so you can judge whether these funds actually matches what you want.
These all-in-one funds have become a default answer to "How should I invest?" for many Canadians, and for good reason: one ticker buys you thousands of stocks across dozens of countries, automatically rebalanced, for few tenths of a percentage point a year. But "just buy XEQT" is advice people may follow without understanding why the portfolio inside looks the way it does. Why is a quarter of it in Canada, a country that makes up only about 3% of the world's stock market? Why do the funds differ on US exposure? And does any of it matter?
This article walks through the building blocks of these funds:
Section 1: What is the current universe of major all-equity ETFs today?
Section 2: Why Canada is such a large chunk of these ETFs, and how much home bias is too much?
Section 3: How the rest of the world is divided, and where the funds genuinely differ?
Section 4: "But the S&P 500 has been outperforming" — what these funds are and are not designed to do?
Section 5: How they have performed?
Section 6: Can you do it yourself for less?
Section 7: Conclusion?
Section 1
The Growing Universe of All-Equity Portfolios
The universe of all-equity ETFs has grown quickly in Canada, and their popularity is reflected in their assets under management. As of July 16, 2026, XEQT from iShares had just over $20 billion in assets. VEQT from Vanguard, had approximately $15 billion under management.
For the purpose of this article, I divide the ETFs into three broad categories:
XEQT, VEQT, ZEQT, and CEQY are built mainly from market-cap-weighted regional index funds, although their regional targets differ.
CEQT, TEQT and HEQT embed more pronounced structural tilts through their regional allocations and company-size exposure.
FEQT and CAGE are less directly comparable with the first two groups. FEQT combines factor-based and actively managed equity strategies with a small cryptocurrency allocation. CAFÉ is an actively managed, systematic portfolio that emphasizes value and profitability characteristics.
This article examines the first two groups as FEQT and CAGE deserve a separate article.
Section 2
Why Canada Is a Large Chunk of These ETFs
Canada represents roughly 3% of the global equity market, yet every one of these funds allocates roughly 20–30% to Canadian stocks. That deliberate overweight is called home bias. It is a design choice with real justifications.
What home bias can and cannot do?
Tax advantages. In non-registered accounts, eligible dividends from taxable Canadian corporations may qualify for the dividend tax credit. Foreign dividends generally do not, and they may also face source-country withholding tax. The rate and recoverability of that tax depend on the country, the account type, and the ETF’s structure.
A hedge against a less open world. The long era of ever-deepening globalization taught investors to take cross-border capital mobility for granted. That era appears to be ending, and capital flows are increasingly used as policy weapons: sanctions, investment restrictions, and changes to the tax treatment of foreign holders especially as the developed world becomes increasingly indebted. Home bias doesn’t shield you from geopolitics broadly, but it does reduce a narrower risk: assets domiciled in Canada are primarily governed by Canadian law, rather than the policy decisions of a foreign government.
Matching your assets to your liabilities. The argument goes that you want Canadian dollar assets as that is the currency you will spend in your retirement. To be honest, this is not a clean argument. A large chunk of the Canadian market is resource producers that often sell commodities in U.S. dollars, and many other Canadian companies earn substantial revenue abroad. A weaker loonie can increase the Canadian-dollar value of those revenues or cushion a fall in U.S.-dollar commodity prices, although foreign costs, debt, hedging, and the reason for the currency move all matter.
But how much home bias is too much?
Too much home bias is costly. Investing in one country confines you to a small slice of the global market and concentrates your exposure to local economic and sector risks. Canada has a particular concentration problem: as of mid-2026, the top 10 companies accounted for roughly 38% of the S&P/TSX Capped Composite, and five of those companies were banks. Financials and energy dominate the index. In good years, that concentration can deliver world-beating returns on the back of a bank rally. In bad years, the same concentration can deliver world-beating losses.
So where is the sweet spot? I tested every combination of two portfolios: one tracking the S&P/TSX Capped Composite Index and one tracking the MSCI ACWI ex Canada IMI Index, then searched for the Canadian weight that minimized historical volatility. The latter index is chosen because it holds roughly 8,000 large-, mid-, and small-cap stocks from developed and emerging markets. This is as close to "the whole world outside Canada" as an index gets. You can also buy it in Canada as an ETF under the ticker XAW (an alternative, tracking the similar FTSE Global All Cap ex Canada Index, is VXC).
In this data set, beginning in 1997, a 100% Canadian portfolio had annualized volatility of approximately 14.7% (returns landing within ±14.7 percentage points of the long-run average in a typical year), while a 100% world-ex-Canada portfolio had volatility of approximately 12.5%.
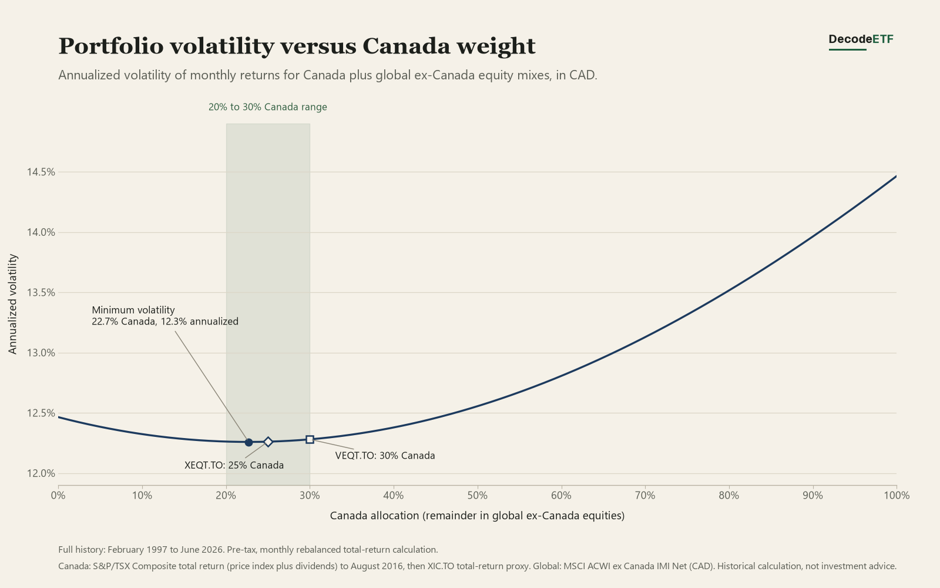
The minimum-volatility portfolio is neither 0% Canada nor 100% Canada. That portfolio sits in the 20–30% Canada region, below the volatility of either pure portfolio. The reason is straightforward: Canadian and global stocks do not move in perfect lockstep. Canada’s resource- and financials-heavy market has often behaved differently from a global market dominated by the United States. When two assets are imperfectly correlated, some of their swings offset each other.
This is precisely where most fund providers landed: XEQT targets roughly 25% Canada, VEQT roughly 30%, and HEQT 20%. Those allocations are consistent with historical minimum-variance research.
Why minimize volatility rather than maximize return?
A fair question. We invest for returns so shouldn't we look for the Canada weight with the best risk/return trade-off, not merely the lowest risk?
The answer comes down to what you can estimate with any confidence. Annual returns are noisy: +20% one year, −9% the next, +15% the year after. Any “optimal” allocation based on historical returns is therefore a bet that the past pattern of relative returns will persist. You are not merely forecasting whether markets will rise; you are forecasting which markets will outperform, and by how much. Those estimates are notoriously unstable. By contrast, the co-movement between markets, i.e. the extent to which Canadian and global stocks rise and fall together, has historically been more stable.
The next chart shows the minimum-volatility Canada weight over rolling 20-year windows, moving forward one month at a time. Twenty years is chosen as a holding period long enough to span a full business cycle; "rolling" simply means we re-run the calculation each month using only the most recent 20 years of data — the June 2018 data point uses July 1998–June 2018, the July 2018 point uses August 1998–July 2018, and so on.
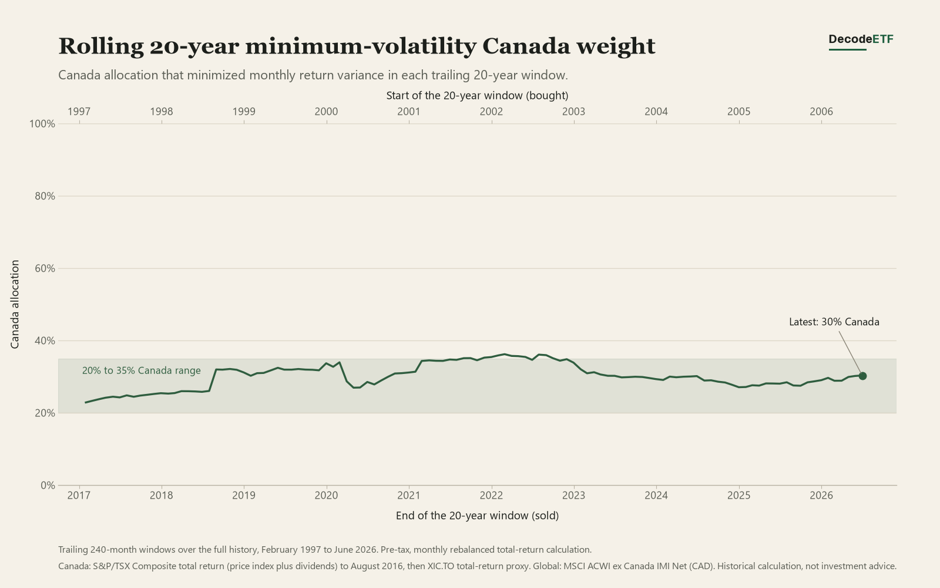
The result: the minimum-volatility Canada share stays remarkably stable, hovering around 20–35% through the dot-com bust, the global financial crisis, the 2010s US bull market, and the pandemic. The estimate moves, but much less violently than a return-based optimum.
Now compare that with a return-based approach. The next chart shows, for the same rolling 20-year windows, the Canada weight that would have delivered the best risk/return ratio.
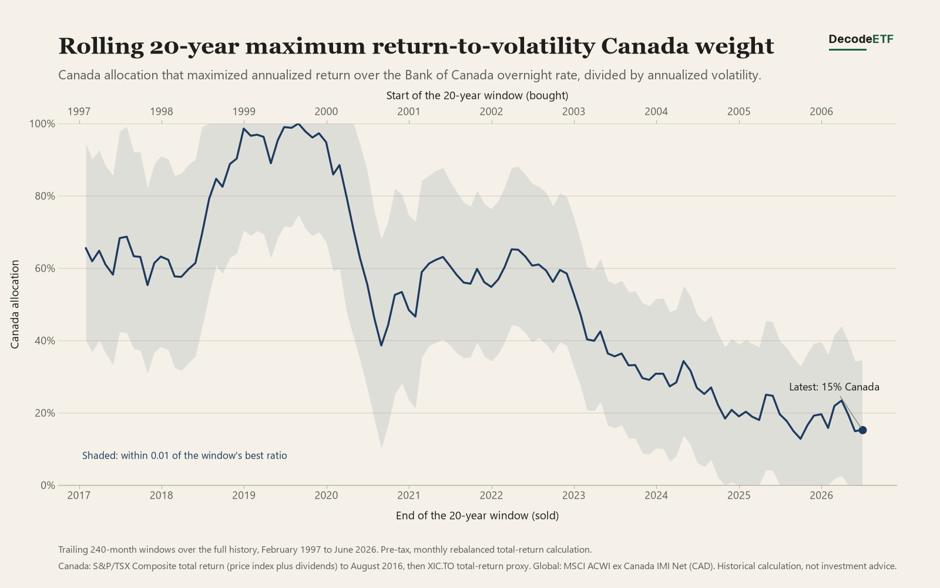
It is all over the place, swinging from 10% to as high as 100% depending on when you happen to measure. The 20-year period ending in 2019 has the share near 100% because of the oil & gas rally in early 2010s when oil was trading in the 120 – 150$/barrel range (170-210$/barrel adjusted for inflation) And remember, these are hindsight numbers. Imagine yourself making the allocation decision twenty years ago, with no foresight about future returns: chasing the best risk/return ratio would have been a gamble, and you may very well be wrong. The minimum-volatility answer can drift too, but it drifts slowly enough to build a portfolio on.
So these funds hold 20–35% Canada not because Canada is special, but because that is the mix at which Canadian and global stocks best cancel out each other's swings.
But I'm investing for 30 years, why should I care about volatility at all?
At this point, you may also ask why should I care about low volatility. I’m investing for the next 30 years so why volatility matters.
They matter, but not because every market decline is a permanent loss. If you have no need to sell and can remain invested, short-term volatility is less important than it is for someone drawing from a portfolio. But it is not irrelevant. For example, a 20% gain followed by a 20% loss does not leave you where you started; it leaves you down 4%. The larger the swings, the more subsequent gains are required to recover from the losses.
A useful approximation is g = u - 0.5x (standard deviation)^2 , where g is the compound growth rate, u is the average annual return (simple average, so if the returns are 10% in year 1 and -5% in year 2 then the simple average is 2.5%), and standard deviation is the standard deviation of annual returns. At the same 8% average annual return, a portfolio with 15% volatility would deliver annualized return of roughly 6.9% a year, compared with about annualized 6.0% for a portfolio with 20% volatility. Put differently, a portfolio with 20% volatility would need an arithmetic average return of about 8.9%, i.e. roughly 0.9 percentage points more per year, to match the compound growth of a portfolio returning 8% with 15% volatility.
This is why minimizing volatility is not the timid choice it might appear. Recall the premise of the previous section: we cannot reliably forecast whether Canada or the rest of the world will deliver higher returns, but their co-movement is more stable and therefore easier to estimate. If we make the neutral assumption that expected arithmetic returns are the same across the different mixes, then the minimum-volatility mix is also, by the approximation above, the mix expected to compound fastest. Under that assumption, the lowest-volatility portfolio and the highest expected long-run growth portfolio are approximately the same portfolio.
The second reason is behavioural, and it compounds the first. A 30-year horizon only helps if you actually remain invested for 30 years. A smoother ride is not just better for compounding; it is also easier to stick with through a severe drawdown.
SECTion 3
Dividing Up the Other 65–80%
The previous section established that 20–35% Canada is the right ballpark. What about the rest?
Recall that we used the MSCI ACWI ex Canada IMI as the "everything else" benchmark: large-, mid-, and small-cap stocks from developed markets (excluding Canada) plus two dozen emerging markets. It is a market-capitalization-weighted index, meaning each company's share of the index is proportional to its total market value. Nobody decides that the US "deserves" a big weight; the US gets a big weight because American companies are collectively worth the most.
As of July 17, 2026, the US accounts for about 63% of this index, Europe about 15%, Japan 6%, emerging markets (including Taiwan and Korea) about 10%, and Oceania about 2%. Scale that to fit around a Canadian anchor and the neutral US weight becomes: about 50% in a 20% Canada portfolio, 47% in a 25% Canada portfolio, and 44% in a 30% Canada portfolio.
So how do the actual funds compare against this benchmark?
Fund | Canada | US | US over/underweight | Note |
TEQT* | 25% | 55% | +8% | Strongest U.S. overweight. |
ZEQT* | 25% | 50% | +3% |
|
XEQT | 25% | 45% | −2% |
|
VEQT* | 30% | 44% | 0% |
|
HEQT | 20% | 47% | −3% | Only large cap in Canadian sleeve. |
CEQY | 27.5% | 45% | 0% |
|
CEQT* | 31% | 36% | -7% | Strongest U.S. underweight. No US small caps. |
Note: Funds with * have weights based on current allocations. Funds without * have weights based on the fund’s allocation targets or benchmark.
The table reveals that the key differentiator among these funds are:
The degree of home bias: Canada weights range from roughly 20% to 30% across the funds. This range is consistent with the minimum-volatility finding from Section 2;
The degree of US overweight: TEQT explicitly overweights U.S. large caps. CEQT materially underweights the United States relative to a global market-cap benchmark. The other funds fall between those two positions.
Size tilt: ZEQT, XEQT and VEQT invest in stocks of all sizes. TEQT, HEQT, CEQY, and CEQT contain more pronounced large- and mid-cap tilts in at least part of the portfolio.
HEQT has the lowest Canada allocation (though still within the optimal range), but note its structural quirks: its Canadian sleeve is the S&P/TSX 60 (large caps only). Its US sleeve's S&P-500, Nasdaq-100 and Russell 2000 components creating substantial overlap in mega-cap growth stocks alongside a separate small-cap sleeve, with no dedicated mid-cap allocation.
What about the rest of the world?
Fund | DM ex North America | EM weight |
TEQT | 20% (+3%) | 0% (−10%) |
ZEQT | 17% (0%) | 9% (0%) |
XEQT | 25% (+8%) | 5% (−5%) |
VEQT(1) | 18% (0%) | 7% (0%) |
HEQT | 25% (+7%) | 8% (−2%) |
CEQY | 22.5% (+6%) | 5% (-4%) |
CEQT | 22% (+7%) | 10% (+2%) |
Note: 1) VEQT holds its developed and emerging market exposure through ETFs tracking FTSE indices, while the others track MSCI or S&P indices. FTSE classifies South Korea as developed; MSCI classifies it as emerging. The table adjusts VEQT's DM and EM figures to be comparable with the other funds.
VEQT and ZEQT are the closest to broad regional market-cap weights outside Canada, but home bias is not their only difference. VEQT uses all-cap FTSE indexes across its regional sleeves. ZEQT uses dedicated U.S. large-, mid-, and small-cap funds, but standard MSCI EAFE and emerging-market indexes internationally.
TEQT holds no emerging markets, so it is best understood as an all-equity developed-market portfolio with an explicit U.S. large-cap overweight. During a rally led by TSMC or South Korean chipmakers, it would have no direct exposure to those companies. It would still hold developed-market semiconductor names such as ASML.
XEQT, HEQT, and CEQY all allocate more to developed markets outside North America and less to emerging markets than a neutral global benchmark at the same Canadian weight. In practice, that means more Europe and Japan and less exposure to emerging Asian markets. The funds still hold emerging markets—unlike TEQT—but they capture less of any rally led by companies such as TSMC.
CEQT currently overweighs both developed markets outside North America and emerging markets while materially underweighting the United States. It remains diversified, but its regional mix is an active departure from global market-cap weights.
Section 4
"But the S&P 500 Has Been Outperforming"
So why should I not just buy VFV?
These funds are designed to provide diversified global equity exposure in one regularly rebalanced portfolio. Funds such as VEQT and ZEQT are not intended to predict which country will lead next. Their Canadian allocations are consistent with historical minimum-variance research.
The home-bias thesis is not that Canada will outperform. It is that Canada’s different sector and economic mix has historically diversified a global portfolio, while the tax treatment of Canadian dividends can add value. The historical relationship has been reasonably persistent, but it is neither fixed nor guaranteed.
What these funds generally do not attempt is to find the country mix with the highest future return. That requires a forecast. If U.S. outperformance continues, a larger U.S. allocation will beat a neutral portfolio. It could also go the other way if today’s high expectations are already reflected in prices. The 2000s were a poor decade for U.S. large caps, especially after inflation.
If you do hold a view that US large caps will keep outperforming and want to express it, TEQT or HEQT are the candidates within this line-up. Both concentrate more heavily in US large caps by construction. Alternatively, if you hold a view that US dominance is at its zenith, CEQT could be an option as it underweights USA. Just be clear-eyed that at that point you are no longer buying diversification; you are making a comparative regional forecast.
SECTION 5
Performance
Given all these differences, how have these funds performed?
As of July 17, 2026, over a 1-year period, CEQT led at 27.9%, benefiting from its overweight positions in Canada (banks) and emerging markets (chips). XEQT trailed at 24.1%, as its overweight to developed markets ex North America underperformed while the emerging markets it underweights outperformed. VEQT and ZEQT, which tracks global market-cap weights almost exactly, returned 24.8-24.9%. CEQY launched last August so there is not yet sufficient history.
Twelve months is, of course, far too short a period to judge anything. Dropping the newer funds lets us look further back: over the past five-year with common history, XEQT and VEQT delivered nearly identical annualized total returns of 13.3-13.4%. The home-bias difference between 25% and 30% Canada turns out to matter remarkably little.
The lesson from the performance data mirrors the lesson from the theory: among the funds that track the market (XEQT, VEQT, ZEQT), the differences are noise. The funds with structural tilts (HEQT) will outperform when their tilt is in favour and underperform when it is not.
section 6
Can You Do It Yourself?
I like IKEA furniture because I like DIY stuffs.
Mostly, yes. It is worth knowing how, because it demystifies what you are buying. You can replicate the market-tracking funds by combining a Canadian index ETF tracking the S&P/TSX Capped Composite with a global ex-Canada ETF such as XAW (MSCI ACWI ex Canada IMI) or VXC (FTSE Global All Cap ex Canada), at whatever home-bias ratio you prefer.
But run the numbers before you bother. Canadian index ETFs charge around 0.05–0.06% MER; the global ex-Canada funds charge about 0.22%. A 25/75 blend works out to roughly 0.18%, against MERs of about 0.20–0.24% for the all-in-one funds You would save perhaps two to four basis points and in exchange you take on the job the fund was doing for you: rebalancing between the two holdings on schedule, resisting the temptation to skip rebalancing into whichever holding has been losing, and executing two trades instead of one with every contribution. For most people, the discipline the all-in-one wrapper enforces is worth more than the basis points it costs. Save the hassle and just buy the fund.
section 7
Conclusion
The all-equity asset allocation ETFs are not arbitrary baskets. They are built around a few defensible ideas: global diversification, a deliberate Canadian overweight, and automatic rebalancing. Historical minimum-variance work puts a Canadian allocation of roughly 20%–30% in a reasonable range, but the exact answer depends on the data, period, indexes, and rebalancing assumptions. Outside Canada, market-cap weights provide a neutral starting point; every departure from them is an active choice.
Judged against those principles, ZEQT and VEQT are the purest implementations; XEQT deviates modestly (overweight developed ex-North America, underweight EM); and TEQT and HEQT embed deliberate tilts toward US large caps that make them part index fund, part market view. CEQT makes the strongest U.S. underweight in the group. None of those choices is automatically right or wrong, but they are different products answering different questions. Pick the one whose exposures you understand and can hold through a bad market. Then automate your contributions, stop tinkering. And, yes, keep visiting this website.
ETF insights, straight to your inbox
We break down what Canadian ETF investors need to know. Free. No account needed. Unsubscribe anytime.