Gold in Canadian dollars gained 38% in 2024 and 57% in 2025. Then it peaked at the end of February 2026 and fell 21% by the end of June. That is the sharpest drop since 2013, and it arrived just as a lot of people started asking whether an ordinary portfolio needs some gold in it.
The case against owning any is well rehearsed. Gold pays no interest and no dividend. It has also gone dead for a very long time before: from January 1980 to August 2000, gold lost 58% of its value in US dollars.
However, gold is not traded the way it was in 1980. You can buy it in a brokerage account in one click now, and futures, options and funds have turned it into a financial asset as much as a physical one. Since 1997 gold has outperformed global equities so rather than assume the old record still applies, I am taking another look at gold as an asset class today.
Here is what I set out to answer:
What kind of asset is gold when you look at how its price actually moves?
Is the diversification claim real, or does it only look real in hindsight?
If it is real, how much would have been the right amount?
Does gold do more for a portfolio than bonds do? Than simply owning more US stocks?
If you decide to hold some, which product actually holds gold?
For the most part, I begin my analysis from 1997 because that is the furthest back I can get global equity index data to allow me to do cross-asset analyses.
SECTION 1
What kind of asset is gold when you look at how its price actually moves?
Gold is not a compounder, not a currency, and not the steady inflation hedge. Rather, it has two unique characteristics. First, it tends to do nothing for long periods and then moves the ocean in short bursts. Second, gold wins less often than the stock market but when it wins it wins big (positive skew).
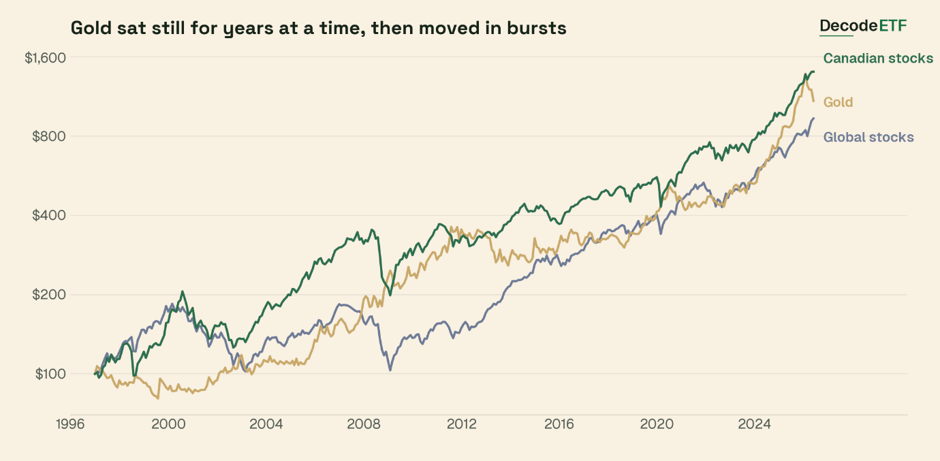
figure 1
Growth of $100 CAD, Feb 1997 to Jun 2026, log scale, monthly. Every series is net of a management fee: assuming gold 0.40%/yr, global stocks 0.20%, Canadian stocks 0.06%. Total-return indices: Global stocks = MSCI ACWI IMI index net total return; Canadian stocks = MSCI Canada IMI, gross total return; Gold = month-end US dollar spot price converted at the month-end exchange rate.
Figure 1 illustrates the first property. Gold spent its first six year declining, bottoming 19% down in 1999. Then it ran hard for eight years, went nowhere again for another eight, and has run again since 2019.
Figure 2 below illustrates the second property.
Historical return statistics, gold vs global equities
feb 1997 - june 2026 (CAD) | Gold | Global equities |
|---|---|---|
Compounded Annual Return (%/yr) | 8.5 | 7.9 |
Volatility (%/yr) | 15.8 | 12.4 |
Biggest Draw Down | -28.8 | -44.7 |
% of months with positive returns | 52% | 62% |
Average monthly returns when returns are positive | +4.1% | +2.9% |
Average monthly returns when returns are negative | -2.9% | -2.9% |
Stocks win more often but when gold wins it wins bigger. When gold rose, the average gain was 4.1% compared to 2.9% of global equities. When gold fell, the average loss was 2.9% the same as global equities. The difference is why gold had a much shallower draw down despite having higher volatility. I will revisit why this is important later in the context of covered call gold ETFs.
section 2
Is the diversification claim real, or does it only look real in hindsight?
Yes at least since 1997. The correlation between monthly gold returns and monthly global stock returns is -0.11. A correlation of 0 means gold and stocks do not move together at all, a correlation of 1 means gold and stocks move exactly the same, and a correlation of -1 means gold and stocks move exactly in the opposite direction.
A long-run average can hide a lot of short-term volatility so I am also showing correlations between gold and global stocks over rolling five- and ten-year periods. The relationship is a bit more volatile as expected over a shorter five-year time frame with correlation exceeding 0 in about 24% of the time. If you are taking a longer term view with a 10-year holding horizon, then the correlation between gold and stocks is consistently below 0 as shown in Figure 3. This is in contrast to bonds where correlation has now flipped positive and no longer provides reliable diversification benefits as discussed in my article on asset allocation ETFs.
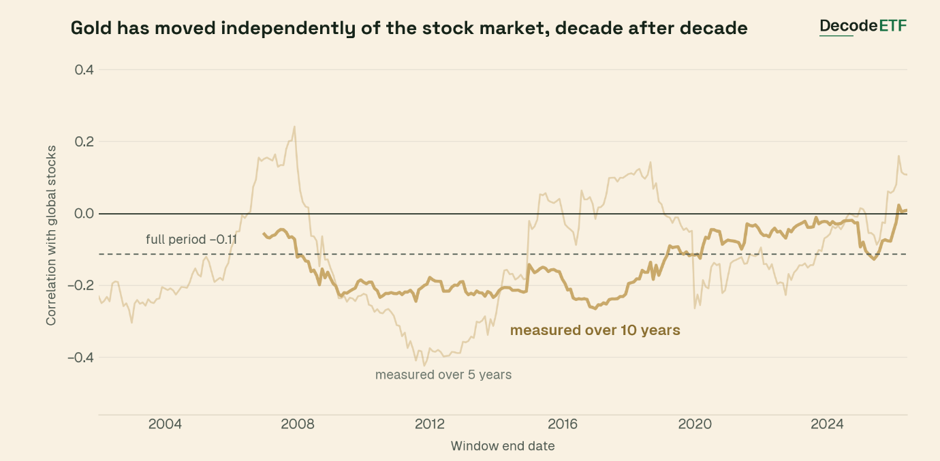
figure 3
Rolling correlation of monthly returns, plotted at the end date of each window. The dashed line is the full-period correlation of −0.11. The ten-year line begins in 2007 because that is the first month with ten years of history behind it. Returns are net of assumed management fees.
How does diversification hold up during times of market stress? The next chart compares total returns of gold and global stock under previous major episodes of large declines in global equities.
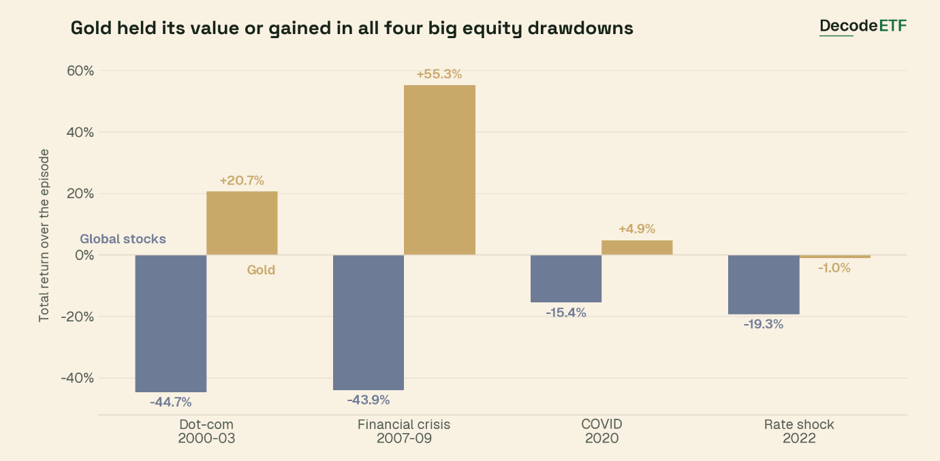
figure 4
The four global-equity drawdowns deeper than 15% in the window (CAD, peak to trough on month-end closes) against gold's total return over the identical peak-to-trough window. Global stocks = MSCI ACWI IMI, net total return (foreign withholding tax deducted), converted to Canadian dollars, less a 0.20%/yr fund fee. Gold = month-end US dollar spot price converted at the month-end exchange rate, less a 0.40%/yr assumed bullion fund fee.
In three out of the four crashes, gold were positive. Gold was up 21% while global stocks declined by 45% during the dotcom bust. Gold was up 55% while equities decline 44% during the 2007-09 financial crisis. Gold was up 5% while equities declined 15% during the Covid episode.
Look hard at the fourth episode, because it is often assumed that gold would underperform under a rising interest rate environment. Yet, gold still came through it down 1.0% while stocks fell 19.3%. A portfolio with a 20% gold sleeve lost 15.6% instead of 19.3%. That is diversification at work.
section 3
If diversification is real, much would gold would have been the right amount?
The answer is actually higher than most portfolios probably hold. Anything from 10% to 30% captured most of the diversification benefits.
The reason is that gold returned about what a global stock index returned over these 29 years, 8.5% against 7.9%, while moving almost independently of stocks. An asset that earns a comparable return without moving in step with what you already own is precisely what you need for diversification. The next question is how much of it to hold, and one way to put a number on that is to ask which mix would have given you the lowest volatility, since smoothing the ride is the main reason to add gold in the first place.
Figure 5 below shows the proportion of gold holding in an otherwise global stock portfolio that would minimize return volatility over different holding horizons since 1997.
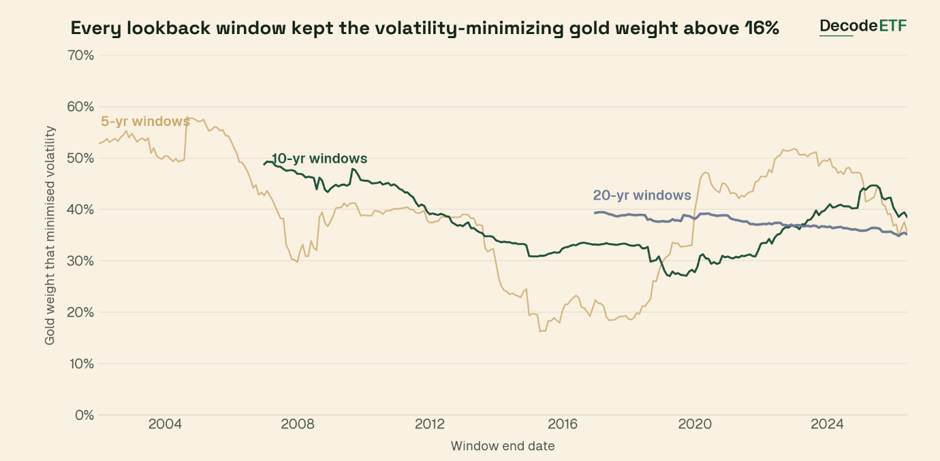
figure 5
Long-only variance-minimizing gold weight computed over trailing 5-, 10- and 20-year windows, plotted at each window's end date.
The weights move around depending on your investment horizon, but there is a floor. The lowest reading is for a 5-year investment horizon at 16% while the median optimal weight across all holding horizons sits between 37% and 40%.
Now I am not suggesting allocating 40% to gold. But the answer is also not 0% either. As the figure below shows, going from no gold to 10% captured 41% of the entire volatility reduction available. Going to 20% captured 73%. Everything between roughly 30% and 50% is nearly indistinguishable. Therefore, you can capture most of the diversification benefits at around 20% allocation.
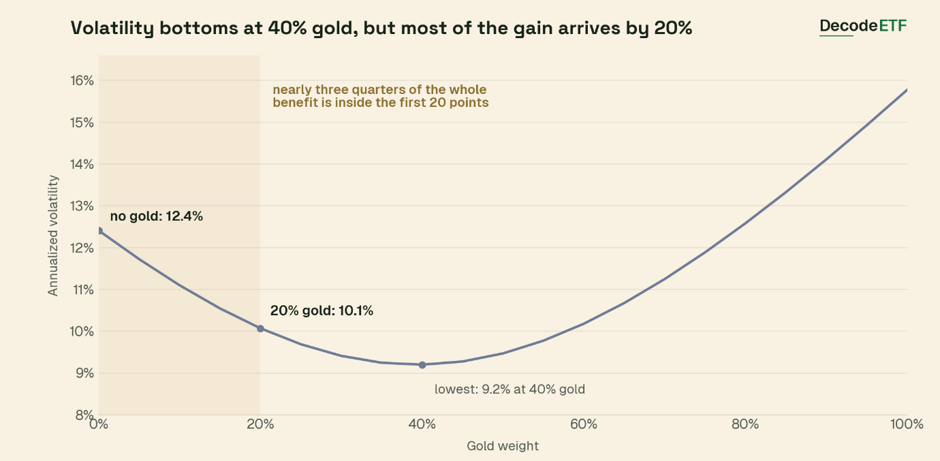
figure 6
Full-period annualized volatility and worst drawdown of a monthly rebalanced global stocks + gold mix.
To see the impact, I have simulated three portfolios using historical data. The first holds 100% stocks and 0% gold. The second holds 10% gold and the third holds 20%, all rebalancing monthly. The figure below shows that the three portfolios have very similar performance over the simulated period with the 20% gold portfolio growing $100 into $1,069 while the 100% stock portfolio grew $100 into $934. Most of the difference comes from rebalancing between stocks and gold because the two rarely fall together.
However, the key difference shows up in volatility and the depth of the drawdown. Volatility falls from 12.4% to 11.1% with a 10% sleeve, and to 10.1% at 20%. The worst drawdown goes 44.7%, then 39.8%, then 34.6%. Some of that shows up in the 2008 dip, where the gold lines fall less far. That's the benefit gold brings as a diversifier.
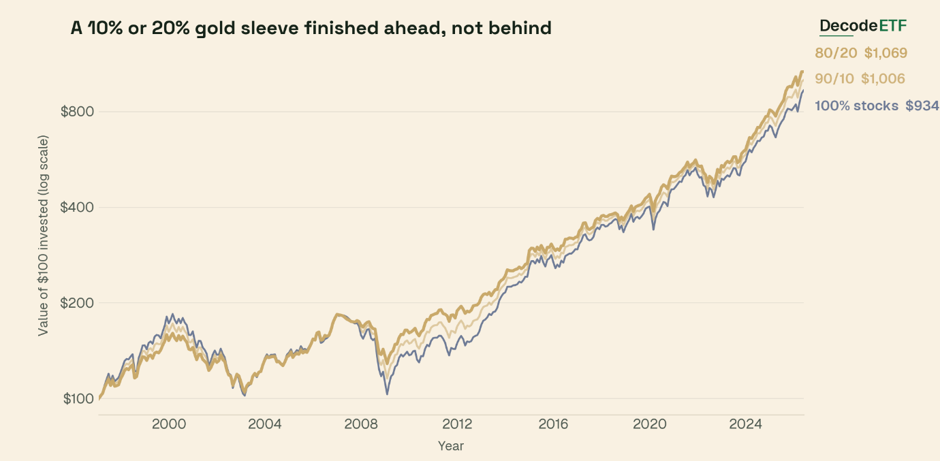
figure 7
Growth of $100 CAD, monthly rebalanced blends of a global stock index and gold, log scale, net of assumed management fees.
section 4
If you are going to give up 20% of your stocks for something, what should it be?
Gold is not the only candidate for that sleeve. The conventional answer is bonds. The popular answer recently is more US stocks. So I ran all three options over the same window. For the same reduction in volatility, gold cost less return than bonds did over this window.
Portfolio Performance Comparison
december 2000 - june 2026 | 100% All Equity (xeqt/vqet style) | 80/20 gold | 80/20 bonds | 80/20 S&P500 |
|---|---|---|---|---|
Annual Return | 7.7% | 8.6% | 7.0% | 7.9% |
Volatility | 11.8% | 9.7% | 9.7% | 11.8% |
Max Drawdown | -41.9% | -27.9% | -33.7% | -41.5% |
2008 Return – Financial Crisis | -29.5% | -19.5% | -23.2% | -28.2% |
2022 Return – Rate Shock | -10.6% | -7.1% | -10.7% | -10.9% |
figure 8
Global stocks = MSCI ACWI IMI, net total return. Canadian stocks = MSCI Canada IMI, gross total return. Gold = month-end spot converted at month-end FX. All in Canadian dollars and net of fund fees: 0.40%/yr on gold, 0.20% global, 0.06% Canada, 0.08% on the S&P 500. The bond series is an actual fund, already net of its own costs. The all-equity base is 70% MSCI ACWI IMI and 30% MSCI Canada IMI, monthly rebalanced, approximating the shape of an all-equity asset allocation ETF rather than tracking any specific fund. The window starts in December 2000 because that is where the bond fund's history begins.
An all-equity portfolio with 20% gold allocation would have outperformed the other allocations considered here. The 80/20 gold portfolio would be as volatile as 80/20 bond portfolio but with 1.6 percentage points additional returns. The 80/20 gold portfolio has the smallest max drawdown and would outperform other combinations during the 2008 and 2022 equity episodes. The 80/20 S&P 500 portfolio provided better returns than 100% all equity but would still underperform gold.
The bond sleeve result may look surprising at first glance. But this is largely the result of the change in regime where bonds no longer provide diversification to equities. For more detailed discussion on this issue, see my other article Canadian Asset Allocation ETFs: Do Bonds Still Protect?
One thing to check is whether this result is just an artifact of when I started counting. The window above begins in December 2000, which is four months after gold's twenty-year low. I ran the same four portfolios again from January 2010. The results show that gold still provides comparable returns to an all-equity portfolio but with lower volatility and shallower drawdowns.
Portfolio Performance Comparison
january 2010 to june 2026 | 100% All Equity (xeqt/vqet style) | 80/20 gold | 80/20 bonds | 80/20 S&P500 |
|---|---|---|---|---|
Annual Return | 11.6% | 11.5% | 9.9% | 12.5% |
Volatility | 10.8% | 9.2% | 9.1% | 10.8% |
Max Drawdown | −17.6% | −13.8% | −16.0% | −17.0% |
section 5
If you decide to hold some, which product actually holds gold?
There are more than a dozen options to buy gold on a Canadian exchange. Some hold gold bullion in a vault. Some hold futures. Some hold bullion and sell the upside for income. The table below shows Canadian gold funds on the DecodeETF database along with annualized return for each fund over a 5-year common holding period to facilitate comparison.
Canadian Gold Funds and Performance Comparison
Fund | Type | 5-yr annualized return | 1-yr Return |
|---|---|---|---|
Spot gold in Canadian dollars | the benchmark | 20.9% | +26.6% |
CI Gold Bullion (VALT.B) | Physical bullion | 21.6% | 30.2% |
BMO Gold Bullion (ZGLD) | Physical bullion | — | 26.0% |
Purpose Gold Bullion (KILO.B) | Physical bullion | 20.6% | 25.9% |
iShares Gold Bullion (CGL.C) | Physical bullion | 20.3% | 25.7% |
Sprott Physical Gold Trust (PHYS) | Closed-end trust | 19.8% | 24.0% |
Mint gold receipts (MNT) | Exchange-traded receipt | 21.4% | 21.1% |
CI Gold Bullion (VALT) | Physical bullion, CAD hedged | 17.1% | 22.6% |
Purpose Gold Bullion (KILO) | Physical bullion, CAD hedged | 16.3% | 18.3% |
iShares Gold Bullion (CGL) | Physical bullion, CAD hedged | 16.0% | 18.4% |
Global X Gold (HUG) | Futures-based | 15.1% | 17.8% |
BetaPro Gold Bullion 2x (GLDU) | Leveraged, daily reset | 21.5% | 21.4% |
BMO Covered Call Spread Gold (ZWGD) | Covered-call spread | — | 21.9% |
Global X Gold Yield (HGY) | Covered-call | 12.0% | 13.1% |
Among the 12 funds, there are a myriad of ways fund providers structure their gold exposure. The first group of funds are similar in that they directly hold gold bullion. Where they differ is the mechanism that keeps the traded price aligned with the value of the gold behind it:
Exchange-traded fund: VALT.B, KILO.B and CGL.C are physical bullion ETFs. Units are created and redeemed continuously by market makers trading against the underlying metal. If the units drift above what the gold inside is worth, it pays someone to create more and sell them; if they drift below, it pays someone to buy units and redeem them. That runs every trading day, and it holds the fund's return to the gold price less the fee.
Closed-End Trust: PHYS is a closed-end trust. Sprott does allow redemption in metal, but monthly, and only in roughly 400 ounce increments or about $2.4 million at today's price. Delivering physical bullion is slow and costly, so the mechanism is too blunt to hold the price in line day to day. Sprott's own June 2026 fact sheet shows the units trading at a 2.98% discount to what the gold inside was worth.
Exchange-traded receipt: MNT is an exchange-traded receipt: each one represents an interest in gold held by the Mint in Ottawa. When the unit price falls below the gold price a holder can redeem, either taking delivery of the bullion, which needs 10,000 receipts and an armoured carrier, or taking cash at 95% of the lower of the market price and the gold's value. That 5% haircut means the price has to drift more than 5% before traders step in to pull it back, meaning that MNT can wander further from gold than the others especially during volatile conditions.
Beyond the physical bullion funds, there are five other types of gold funds catering to different objectives.
Currency-hedged funds: VALT, KILO, CGL are versions of the physical bullion ETFs but with currency hedging to Canadian dollars. The hedge cost 4-5% in annual returns relative to spot gold over the past five years, though most of that is the currency move the hedge removed rather than a fee, and it would run the other way if the loonie rose.
Futures fund: HUG is a fund holding futures contracts on gold, not physical bullion. Futures allow the fund to avoid incurring bullion storage fees but they have to be sold and repurchased as the futures contracts approach expiry. When longer-dated contracts cost more than near ones, every roll gives up a little. Over five years that results in 6% cost per year.
Leveraged fund: GLDU offers 2X exposure to gold. But as you can see in the table the realized five-year annualized return is nowhere near 2X the performance of gold. This is because the fund has a daily-reset feature. In other words, it only delivers 2X returns on the day not over time. If gold moves up 2% today it will return close to 4% today so going from 100 to 104. If gold then moves down 2% the next day, the fund will move down 4% but from 104 so that's (1-0.04)*104 = 99.84. So while gold is essentially unchanged over the 2-day period, GLDU loses 0.16%.
You can also get covered call versions of gold ETFs. However, recall the discussion we have about the unique characteristics of gold? Gold tends not to move much but when it moves it moves a lot to the upside (positive skew). If the fund has already sold call options when the large upside moves happen, then it will miss the majority of the gain. Over 14 years HGY captured only 68% of the metal's gains in months it rose more than 5%, but still took 85% of the losses in months it fell more than 5%. Generally, it is my view that one should not use covered call strategy on assets with positive skew like gold because you are going to give up too much price appreciation in return for options income.
The industry appears to have noticed. BMO's newer product writes a call spread rather than a plain call, which means it sells a call at one strike and buys another further out, so the cap applies only to a band and the fund participates in the upside again above the band. Over the 13 months both funds have existed, the spread version captured 88% of the metal's up months against the plain version's 82%, and the gap was widest in exactly the months you would expect: when gold rose 13.2% in September 2025 the plain fund returned 8.7% and the spread 10.7%, and when it rose 12.1% in January 2026 the plain fund returned 9.5% and the spread 10.9%. The fund still underperforms holding actual gold by a significant margin.
conclusion
So is there still a role for gold in a portfolio?
I think yes. Gold has returned about the same as global equities since 1997 while moving almost independently of them. That is what you want out of a diversifier and it is not easy to find in other asset classes.
On how much, the answer is a range rather than a number. The volatility minimizing weight never went below 16% but most of the benefit is already captured by 20%. Somewhere between 10% and 20% seems reasonable to me.
And if you do buy some, keep it simple. A plain unhedged physical bullion ETF gives you gold minus a fee of 0.155% to 0.50%. Every fancier structure in the table cost between 4 and 9 percentage points a year against just holding the metal.
ETF insights, straight to your inbox
We break down what Canadian ETF investors need to know. Free. No account needed. Unsubscribe anytime.